Using a Gantt chart, you can see, at a glance, which tasks are currently the highest priority, and you can easily see the estimated completion date of the project. Unless you use a Gantt chart template, there’s no native tool that lets you build one. However, with a few simple tricks, you can manually create a dynamic Gantt chart in Excel. Here’s how.
Create Your Project Timeline Spreadsheet First
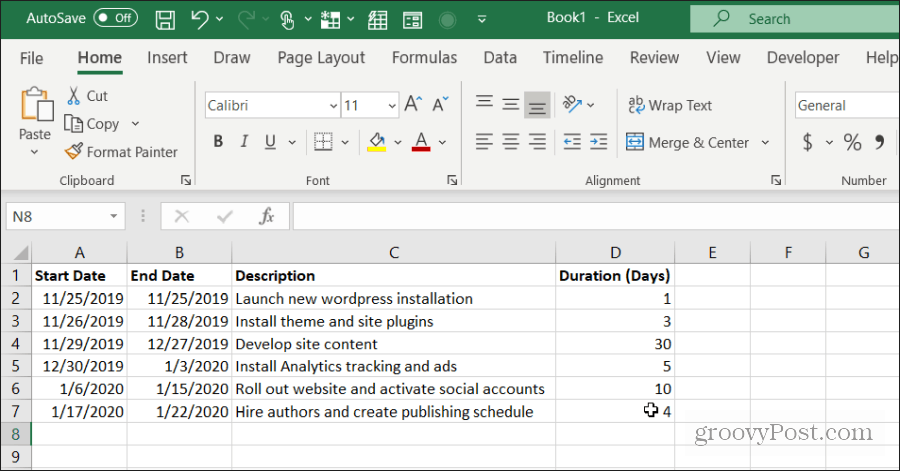
Before creating your project Gantt chart, you’ll need to create the spreadsheet to support it. This spreadsheet should contain the Start Date, End Date, Description, and Duration for each task.
Once you’ve laid out your project, it’s time to create your Gantt chart.
Create a Gantt Chart in Excel
You can have your Gantt chart display in a new sheet, but draw data from the original sheet where your project timeline is stored. Open a new spreadsheet, and select Insert from the menu.
Insert Start Dates into Gantt Chart
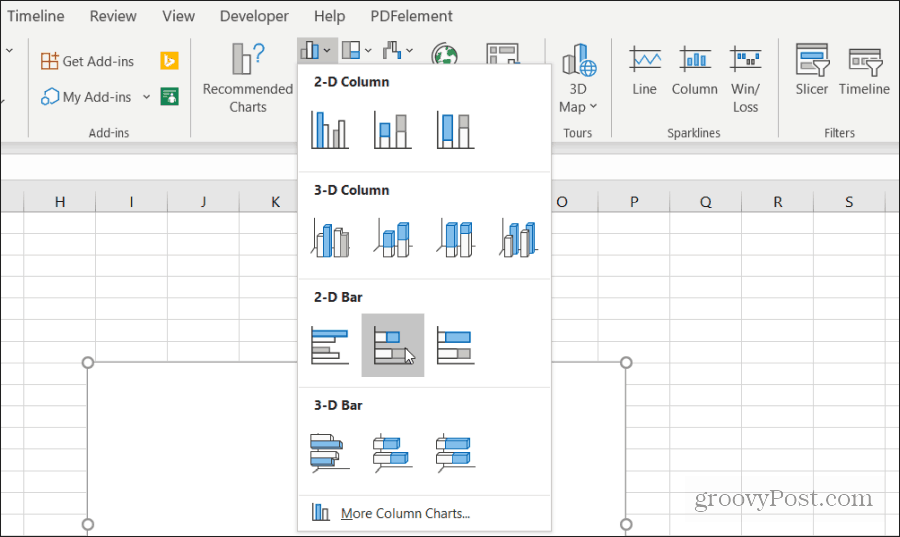
In the Charts section, select Bar Chart. From the dropdown, select the Stacked Bar chart.
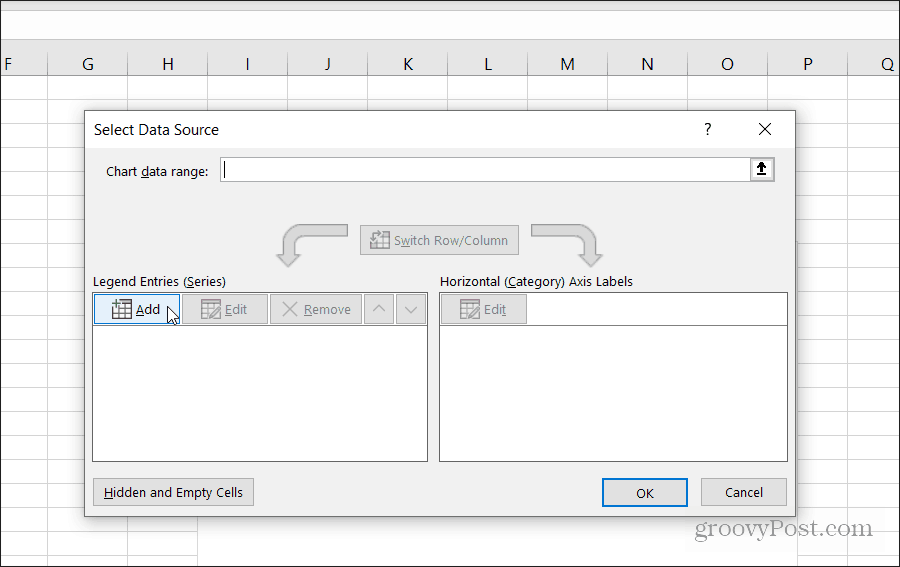
This bar chart serves as the visual indicator of the duration of each task. Next, you’ll need to set the bottom legend of the chart as the start date for each task. Right-click on the blank chart and choose Select Data. Under the Legend Entries field, select the Add button.
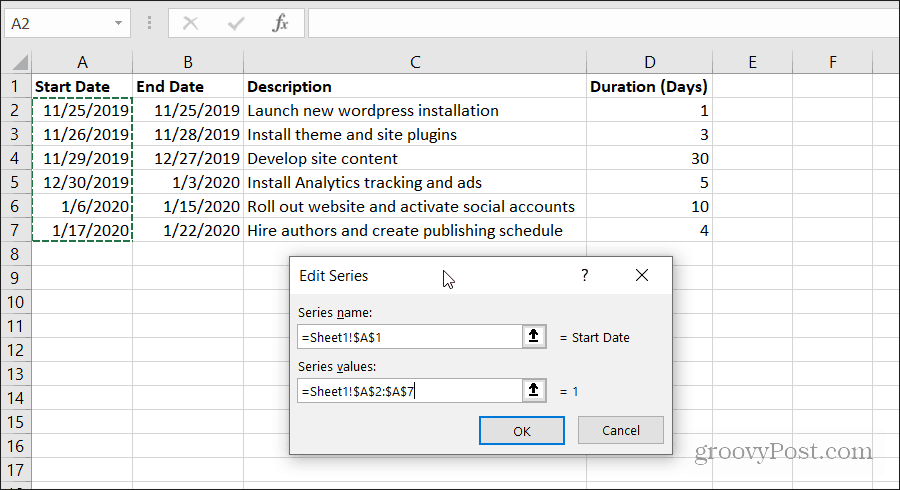
Select the Series name field and then open the sheet where your project schedule is stored. Choose the Start Date header. Next, select the Series values field and select the entire range of start dates for your project tasks.
Select OK when you’re done. Your chart will look something like what’s shown below.
This is a good start, but it’s not a Gantt chart yet.
Add Durations to Your Gantt Chart
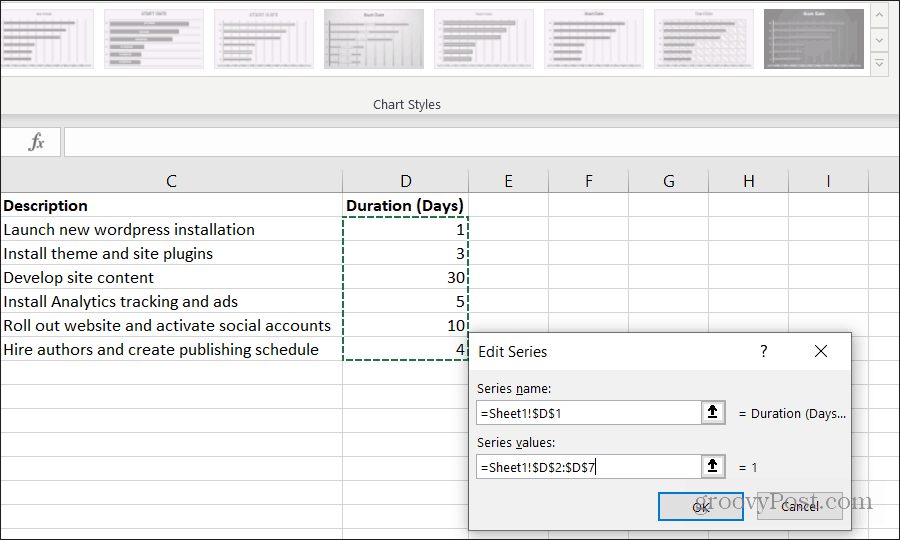
Now it’s time to add a visualization to represent the duration of each task. Right-click on the chart and choose Select Data. Under Legend Entries, select Add again. Repeat the same process as above, but this time select the header and the data from the Duration field.
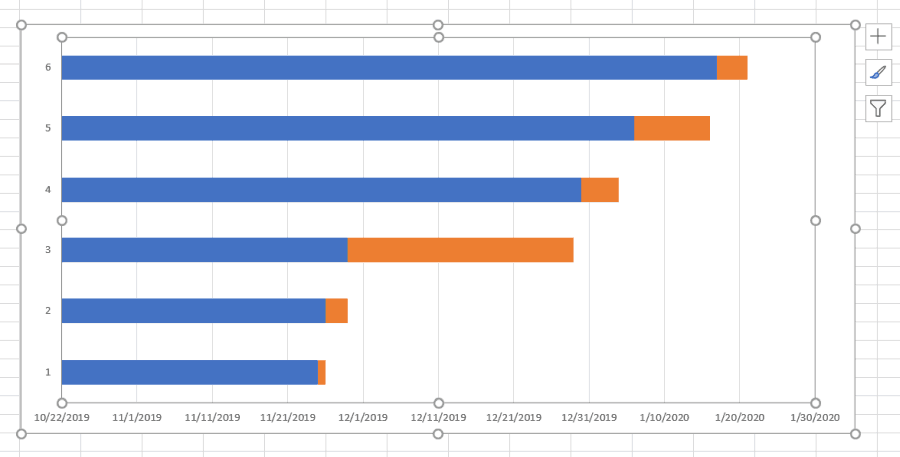
Select OK when you’re done. Now you’ll notice that your Gantt chart has a section of a bar chart for each task that represents the task duration.
It starts where the last task finishes and ends where the next task begins.
Add Task Descriptions to Gantt Chart
You’ll notice that the only thing missing from your Gantt chart is the task descriptions. Adding these is just as easy as the dates and duration. But this time around, you’ll need to update the Axis labels. Right-click the chart and select Select Data. Under Horizontal Axis Labels, select the Edit button.
This time, for the Axis label range, select the range of cells containing the task descriptions.
Select OK to finish and OK on the Select Data Source window. Now you’ll notice that your chart is looking a lot more like a Gantt chart. However, the blue part of the bars in the chart shouldn’t be there. Not to worry, removing those is easy.
Finishing Touches On Your Gantt Chart
Right-click on one of the blue bars and select Format Data Series.
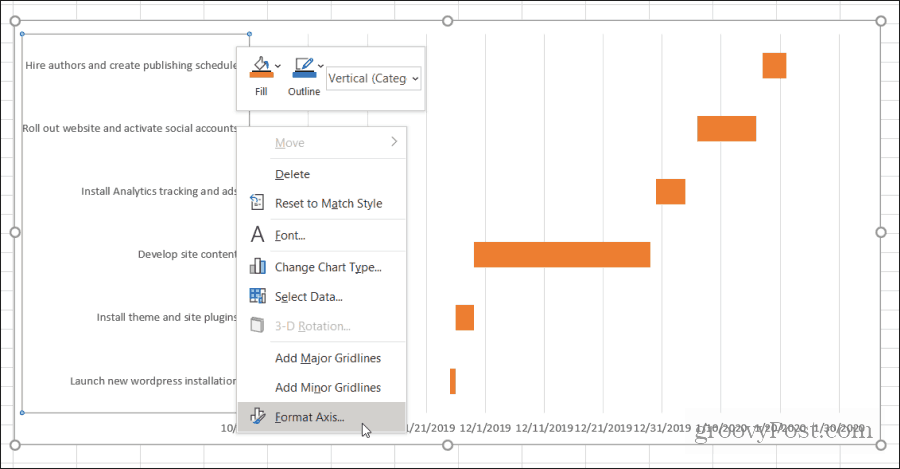
Select the Paint icon on the right menu. Then select No fill under Fill, and select No line under Border.
Now your Gantt chart finally looks like a Gantt chart. The only problem is that your project tasks are listed in the reverse order that they should be. What you want is the task with the earlier start date to be listed at the top, the text below it, and so on. To fix this, left-click on the left axis and choose Format Axis.
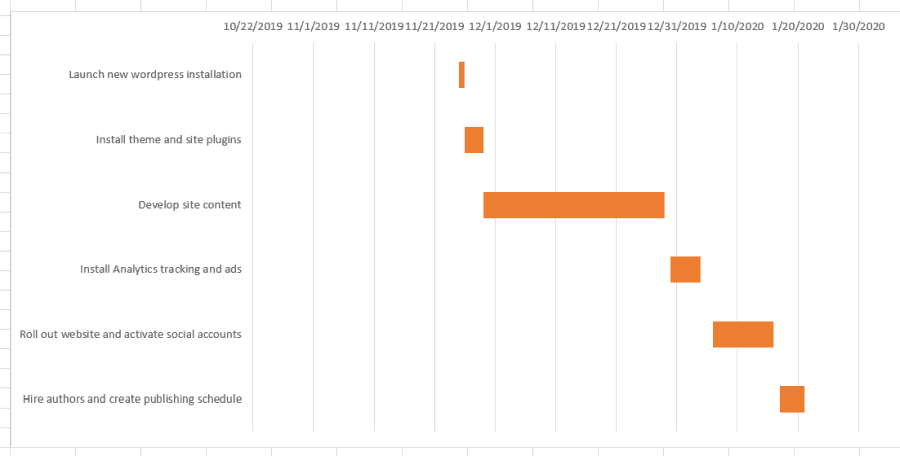
Under the Axis Options section, select Categories in reverse order.
Now you can see that your Gantt chart lists all of your project tasks in the correct order. Only the duration of that task shows up in the Gantt chart. Everything is aligned with the correct date range when that task is scheduled to be active.
Your Gantt chart is done. But there are a few things you can do to further format the chart and polish it up.
Polish Up Your Gantt Chart
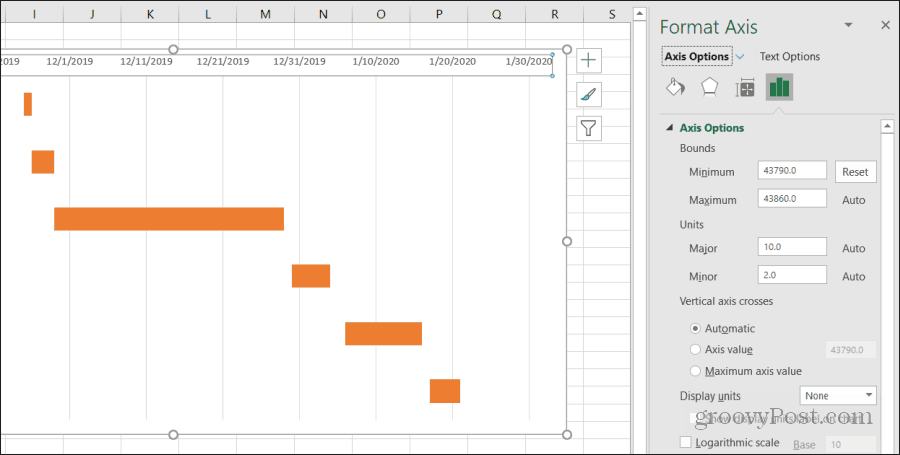
You might have noticed that your Gantt chart has a lot of white space. There are a few things you can do to fix this. Select the dates above the taskbars. Then right-click and select Format Axis. In Axis Options, under Bounds, play around with increasing the Minimum Bounds until the tasks are close enough to the vertical axis of your Gantt chart.
If you increase it too much and the bars move off the display area, press the Reset button to start over. You might have also noticed that the dates are pretty much pushed together at the top of the chart with very little space between them. There are a couple of things you can do to fix this.
In the same Format Axis menu above, you can tweak the Major number under Units to decrease the space between date labels by decreasing the number. Increasing Major will increase the space.If your project takes place within a single year, you can remove the year from the Start Date to use only month and day. This will create a lot more label space for your Gantt chart.
When you’re done, you have a final Gantt chart that offers people a rapid and easy-to-read overview of your entire project.
Once you work through this process with a few of your projects, creating a Gantt chart will become second nature. It’s swift and easy to build a Gantt chart out of your project spreadsheet in less than 10 to 15 minutes.


![]()
